
A score can change because a website changed, because its conditions changed or because the measuring tool changed. PageSpeed Insights now uses Lighthouse, following Google’s announcement on 12 November. It brings a different performance analysis alongside Chrome User Experience Report data. If an owner has been tracking the old report, the first job is to understand the new measurements before announcing either a success or a failure.
A test run and a visitor history are different views
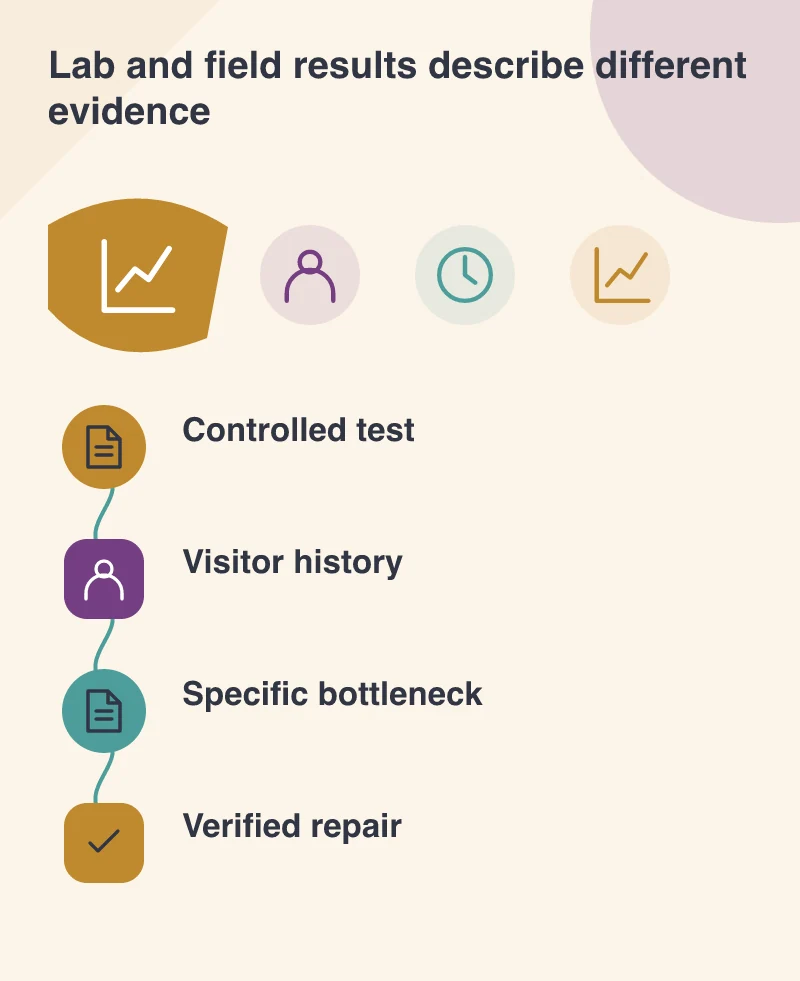
The lab section runs a controlled analysis and provides timings and diagnostic suggestions. The field section reflects eligible real-user experience over a preceding period. These views can disagree without either being meaningless. A controlled run may reveal a reproducible bottleneck, while the visitor history includes a mixture of devices, networks and earlier versions of the page.
Imagine replacing a very large introductory image this afternoon. A new lab run can help check the immediate effect under the test conditions. The historical field data will still include earlier visits. Expecting both sections to change together can lead a team to reverse a useful repair simply because it has not yet displaced the older experience in the history.
Read a timing before choosing a remedy
The announcement identifies lab measures including First Contentful Paint and Time to Interactive. They describe different points in loading. A page may begin showing content while its scripts still keep controls from responding usefully. Ask what the visitor sees and can do during that interval, especially on the device and connection the business needs to support.
Look at the request and execution evidence behind a recommendation. An oversized image suggests a different repair from a long script task. Removing a photograph, adding a cache and minifying a file are not interchangeable responses to every low score. Match the work to the measured obstacle and keep the important content intact.
Compare like with like
Save the URL, date, test mode and report when establishing a baseline. Compare representative service, article and product pages, since their templates may load different resources. A home page result cannot stand in for an entire catalogue. Repeat a surprising run under comparable conditions before turning a single number into a project priority.
The new score is not a direct continuation of every previous score produced by the tool. Explain that to the person approving the work. A chart that joins different measurement systems without annotation can make a stable site look as though it suddenly deteriorated. Keep the history, but mark the change in how it is measured.
Protect the actual task while making it faster
For a booking page, the calendar and submission controls must remain usable after an optimisation. For an article, text and images must still explain the subject. Test those tasks alongside the performance result. Deferring a necessary script until the button fails is not an improvement that a customer will appreciate.
Use the report to choose one evidence-backed change, verify its effect and move to the next constraint. The business gains more from a faster, dependable journey than from a number whose limitations nobody can explain. Keep real-user history and controlled testing in the discussion, because they answer complementary questions.